In this article, we go over the main features of Bumblewing. This is a great introduction for those who are curious to know more about Bumblewing, for those who have just registered or for you who have used Bumblewing for a while and want to take advantage of all the functionality available.
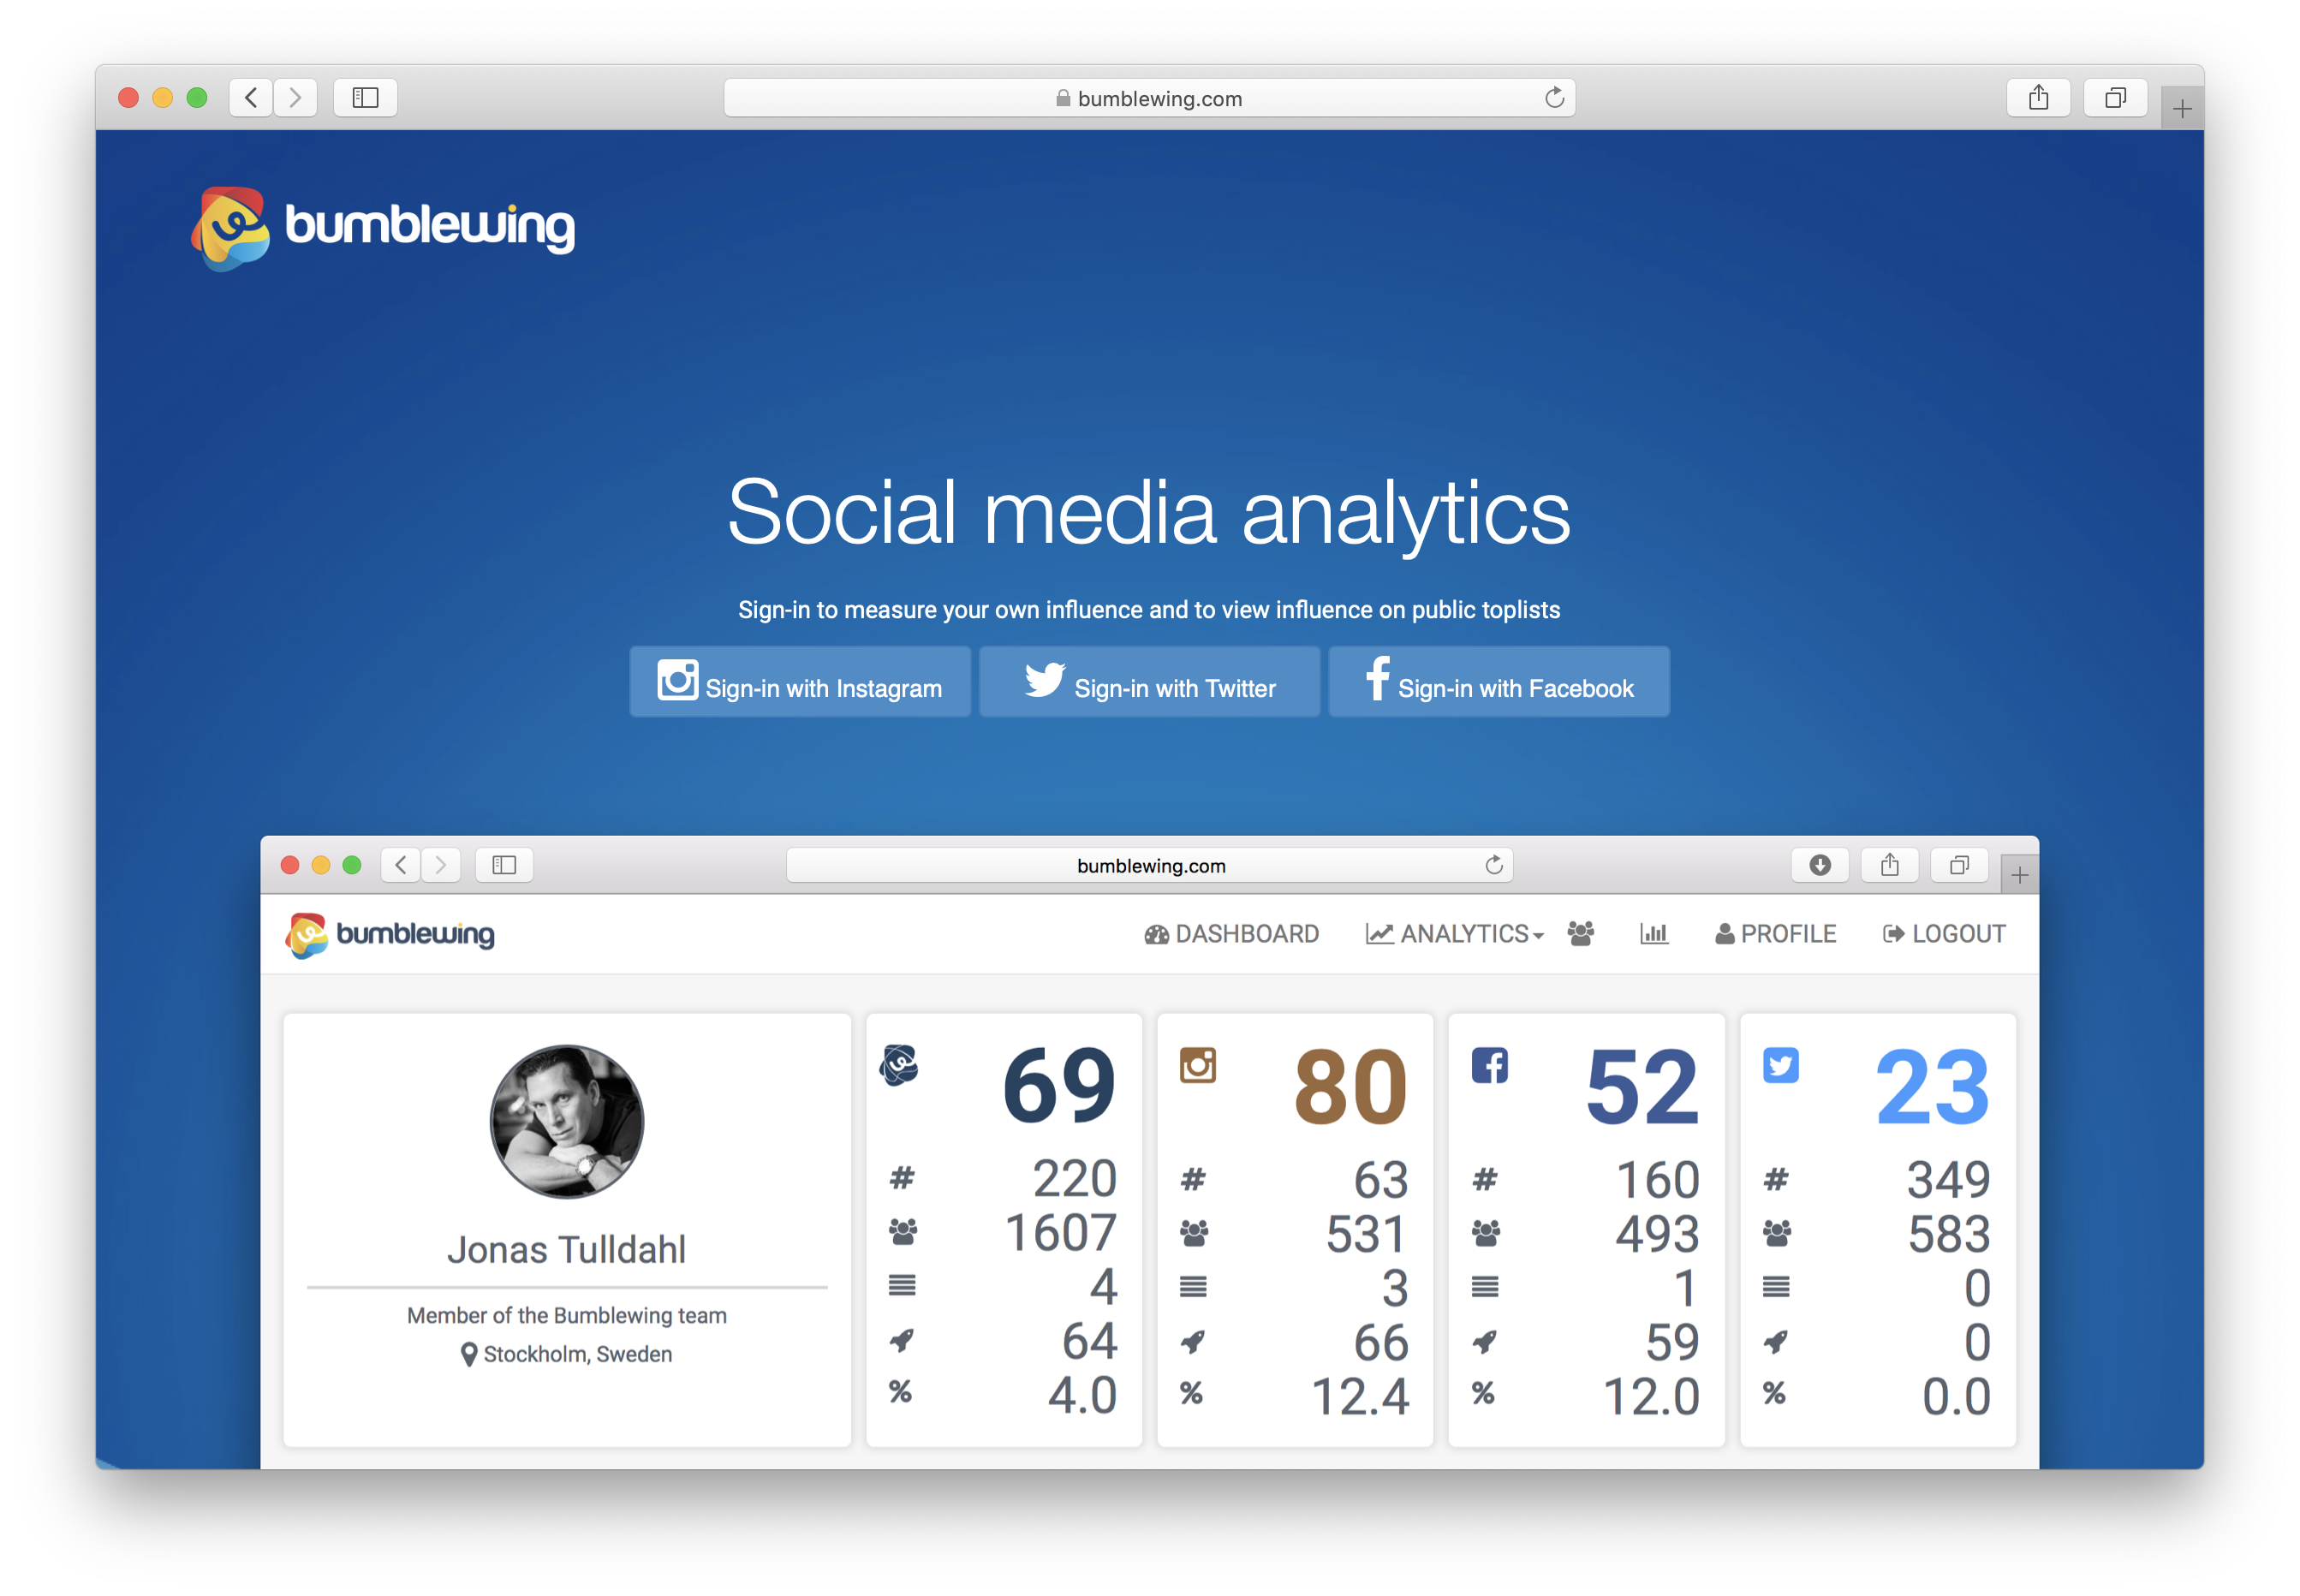
Registering is very easy. You can choose to register with Facebook, Instagram or Twitter. Register by clicking one of the buttons on the home page, and then follow the instructions. You don't have to worry too much about choosing Facebook, Instagram or Twitter to sign up with, you can link all your accounts to your Bumblewing profile once you have registered.
It is not more difficult than that. Did we mention it's free too?
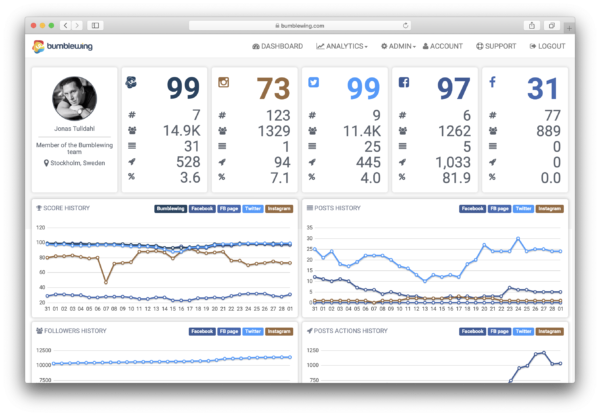
The first screen you see when you register and the first screen you see every time you log in to Bumblewing is your personal "Dashboard". It is on this page you will find statistics about your own influence in social media.
The first time you log in you will see a message at the top of the page saying that Bumblewing is currently working on loading your data. Be patient, it may take a little while, but this will only happen the first time you log in. Bumblewing then keeps your data updated in the background.
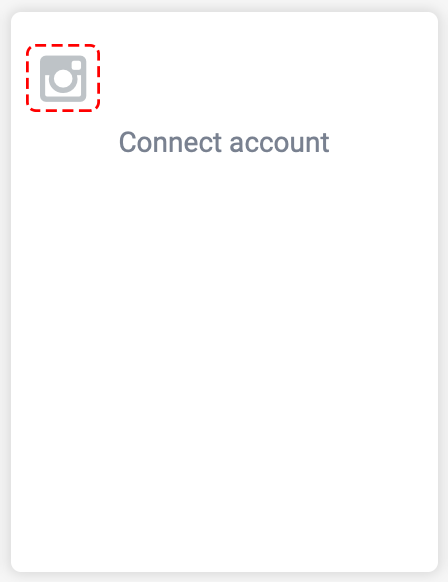
Once you are logged in and see your dashboard, you can easily add your additional accounts to your Bumblewing profile. You do this easily by clicking on the respective social media icon. To get higher Bumblewing points, it always pays to connect to more accounts, it can never contribute negatively to your overall score.
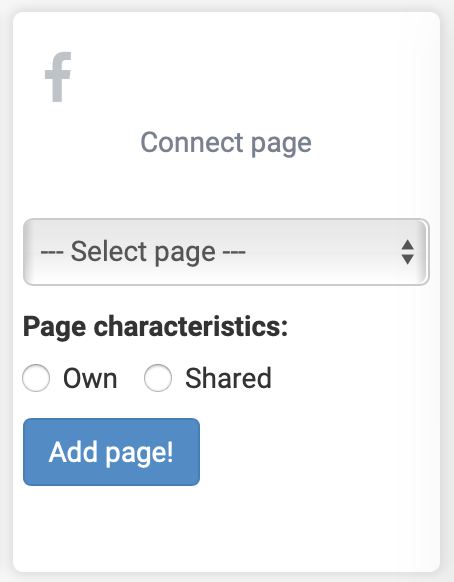
You can also link a Facebook page to your Bumblewing profile. However, this requires that you have an admin role linked to that page. If you have an admin role for Facebook pages, you can choose to link to one of these, you can only link one page to your Bumblewing profile. However, you can easily switch pages later if you wish. When you link to a Facebook page, you also need to specify if you own it alone, ie it is your personal Facebook page ("Own") or if it is a page that you administer to a company or organization ("Shared" "). Statistics for a shared page can be linked and measured, but you cannot count it on your total Bumblewing score.
On your Bumblewing profile you will find a lot of data and graphs to help you understand your influence in social media. In general, you can hover your mouse over a data point to get exact points, the same goes for those using Bumbelwing on your mobile, but then you need to point to a data point. For each graph you can also choose which data to display, you can click away data that you do not want to be displayed by clicking on the respective legend, eg. "Facebook" if you do not want to see Facebook data in the graph.
SCORE HISTORY
Displays up to 30 days history for points on each platform (Facebook account, Facebook page, Twitter and Instagram) as well as total Bumblewing points.
POSTS HISTORY
Shows on average how many posts you made on each platform over a 7-day period.
FOLLOWERS HISTORY
Displays up to 30 days of history with number of followers per platform.
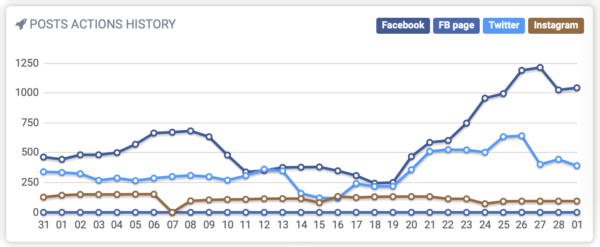
POSTS ACTIONS HISTORY
Shows on average how many reactions you get per post on each platform, eg. how many likes, comments and shares you get on average per post you make on Facebook. For Instagram, likes and comments are measured and for Twitter, likes, mentions and shares are measured.
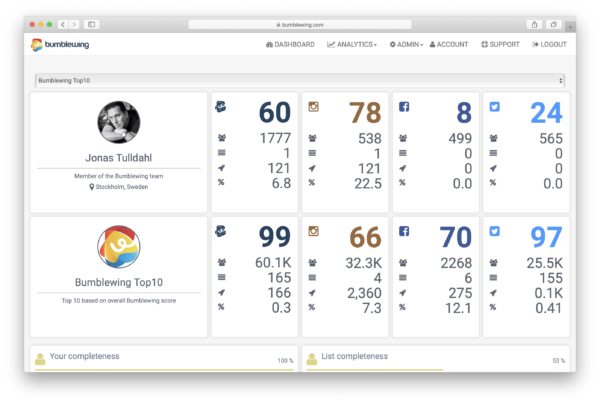
At Bumblewing we believe very much in transparency, we believe that these are the prerequisites for a good analysis platform. This is also why we always show exactly what data we have read from the respective social media account that you have chosen to link to your Bumblewing profile.
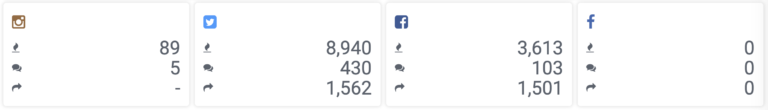
Here we show the total number of likes, comments and shares that we have analyzed for posts that you have made on the respective social media platform. The data shows seven days of history. For Instagram, we do not measure the number of shares.
Expired token
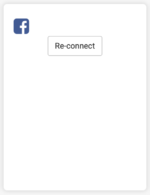
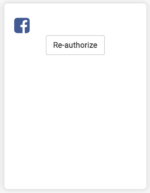
When you register with your social media account on Bumblewing, Bumblewing receives a so-called "token", it is a unique key that makes it possible to read data from your posts. However, this token has a best before date. This means that it can grow old and thus need to be renewed. You see this because instead of data there is a button where it can say "Re-connect". Click the button and follow the instructions and you will solve this quickly. For Facebook specifically, you can sometimes also get a button that says "Re-authorize", the same applies in this case, click and follow the instructions so the problem solves smoothly and data becomes visible again on your profile.
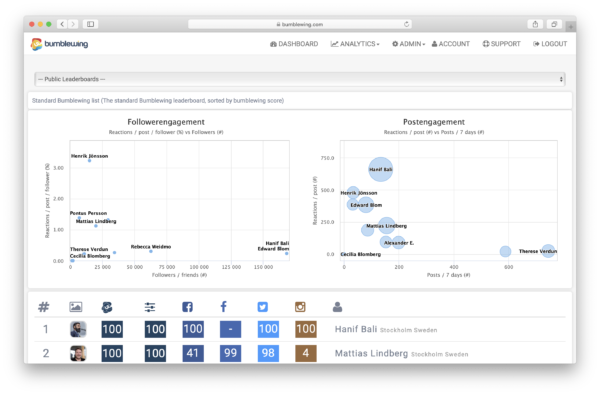
Leaderboard is the official leaderboard for anyone who has registered and uses Bumblewing. The sort on the list is the total Bumblewing score, ie. total influence in social media based on all platforms that users have chosen to connect.
On the Leaderboard you can always see the top 10 rankings, ie. the 10 users who have the absolute highest influence of all users on Bumblewing. If you are not among the top 10 users, you will also see your own placement plus / minus five users.
By default, Leaderboard shows top users and rankings based on the Bumblewing score. You can also choose to view the top 10 users sorted on Facebook, Instagram and Twitter.
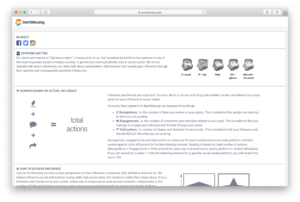
The top two graphs displayed on the Leaderboard are important and they also basically explain how Bumblewing measures the influence.
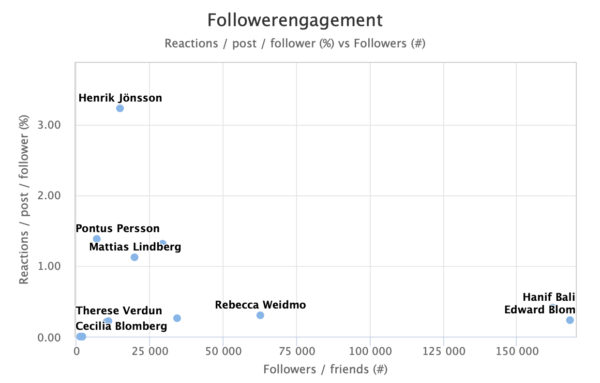
Following Were Gage Movement
If the horizontal axis shows the total number of followers for the different users, then the number of followers / friends from all accounts that users have chosen to connect to their Bumblewing profile is summed up, thus this is a measure of the user's network, or theoretically possible scope. The vertical axis shows the percentage of followers / friends who respond on average to each post. Measured as a percentage (%). So this is a measure of the commitment of your followers / friends. By reactions we mean for Facebook likes, comments and shares. For Instagram, likes and comments count, and for Twitter, likes, mentions and shares.
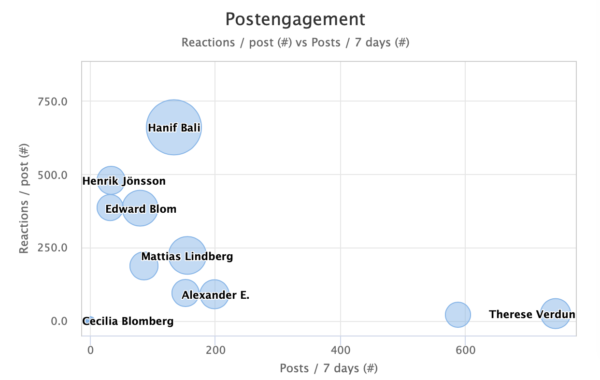
Post-Gage Movement
Shows on the vertical axis total number of reactions you get on average per post. This is measured in the number of reactions. You get this measure if you multiply the size of your network by the proportion of networks that respond to your posts. The horizontal axis shows the number of posts / tweets you have made over the past seven days. The size of the bubble is a measure of total influence measured as the number of reactions per post averaged multiplied by the number of posts over the past seven days, ie. total number of reactions to posts made in the last seven days.
The benchmark page gives you the opportunity to compare your own statistics with other users on Bumblewing. This is a good page if you want to understand how you can improve your own influence.
On the benchmark page, for example, you can see if you have fewer followers than the top 10 on the list, or maybe you have lower frequency on your posts.
By default, here you can compare your own stats against top 10 users on Bumblewing, but you can choose to compare with top 10 Facebook, Twitter or Instagram.
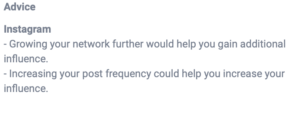
On the benchmark side, you can also get specific advice on how to improve your influence. You will find these at the bottom of the page. This Bumblewing's own interpretation after comparing your own statistics with the top 10 users you have chosen.
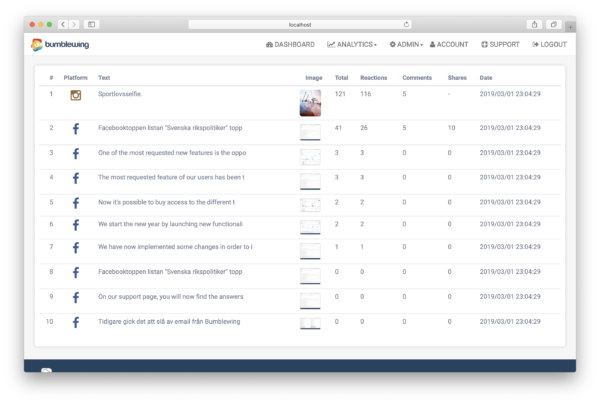
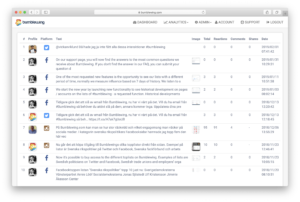
The "Posts" page allows you to see your posts ranked based on total influence. Posts made in the last 30 days are displayed on the page.
For Facebook posts, likes, comments and shares are measured. For Instagram, likes and comments are measured, and for Twitter, likes and shares are measured.
List Overview
Lists is a feature where the team at Bumblewing put together relevant Facebook pages and Twitter accounts into different lists. The algorithm used to measure influence for logged in users is then used for these lists to rank the various accounts / pages included in the lists.
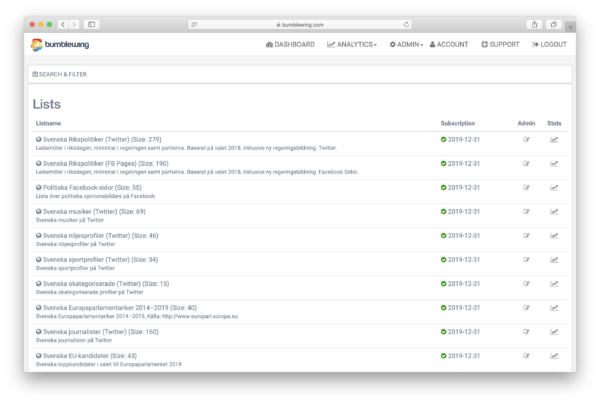
In the list overview you will see all public lists listed with a name and a short description. You also see how many accounts / pages are included in the list. On this overview you can also see which lists you currently have a valid subscription.
In the search / filtering function at the top of the page you can search for specific list, or for example choose to display only lists that you subscribe to.
If you want to compile your own list, you can do well, just contact us info@bumblewing.com then we explain how it works.
List View
In the list view you can see all information linked to a specific list, here you will see key data for all Facebook pages and / or Twitter accounts included in the list.
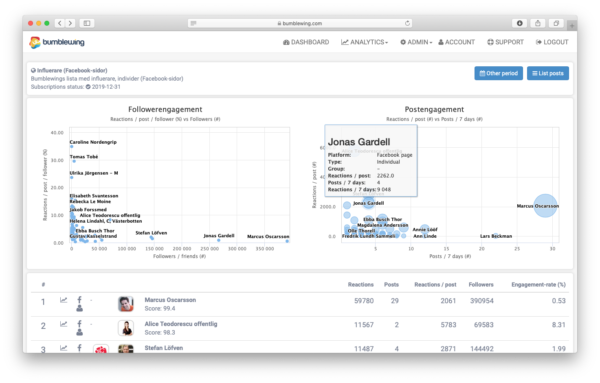
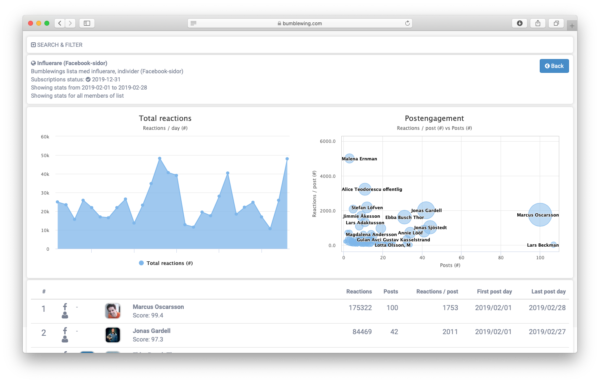
At the top of the page you see two graphs that show an overview, this is the result of Bumblewing's algorithm for measuring influenza in social media.
The graph on the left shows on the horizontal (Followers / friends (#)) the total size of the network for each member in the list, ie. number of followers or friends. The vertical axis then shows the proportion of the network that responds on average to each member's post (Reactions / posts / follower (%)). Ultimately, it is best to be located in the top right corner, ie. a large network where a high proportion is involved.
If you multiply the two dimensions in the left graph you get the average number of reactions per post and this is what is shown on the vertical on the right graph (Reactions / post (#)). The horizontal in the right graph then shows the number of posts or tweets in the last seven days. If we multiply the two dimensions in the right graph we get the total number of reactions for posts / tweets made in the last seven days, that is what we mean is influenza. It is illustrated with the size of the bubble. And that's also the basis of ranking on the lists when you first go into them.
In the table below the graphs you will find all data associated with each member. Most columns can be clicked to sort the table, for example, you can choose to sort the table to see which of the list's members has the most followers.
User / p-development
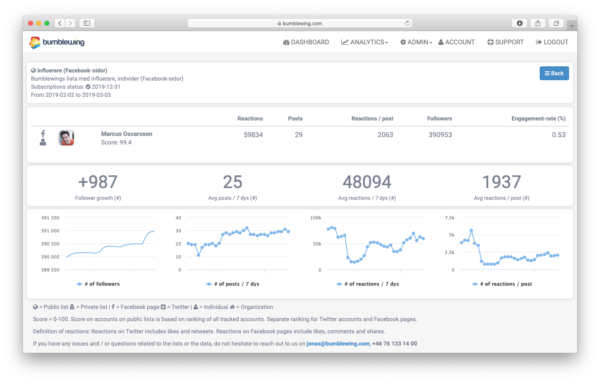
Once inside a list, the subscriber of the list can click on the graph symbol on the respective line. Then an overview is displayed specifically for the selected member with key data showing the historical development of the member over the last 30 days.
The first graph shows the development of the number of followers, the second graph shows the development of the number of posts during the seven-day period. The third graph shows the total number of reactions per seven days and the last graph shows the number of reactions per post on average.
Above each graph there is the average value for the entire period.
This page can be used to see how influenza for a member on a specific list has developed over the past 30 days.
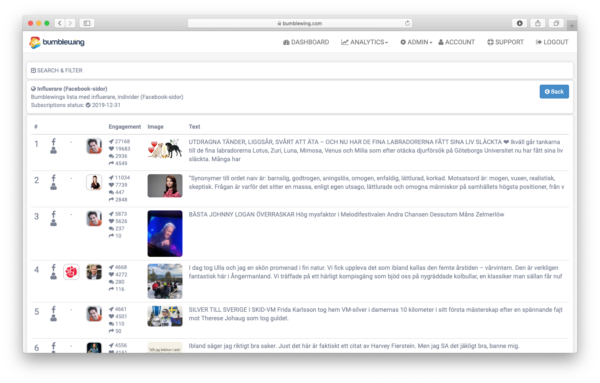
posts Analysis
The Post Analysis is an analysis that allows you to see exactly which posts generated the greatest influence over a given period (in the initial state when you enter the page always 7 day period).
The posts displayed on the page are sorted by the number of reactions received by each post.
You can search / filter among the posts, for example by choosing a different time period, searching for a specific keyword, etc.
Custom period
By default, Bumblewing shows influences for the various members on a list of posts / tweets made over the past seven days. However, it is possible to adjust if you are interested in seeing rankings of the list based on different time period.
On this page you can select the start and end dates and when you click "Update" Bumblewing shows rankings on the list based on the selected time period.
Note that this list differs slightly from the normal list. For example, this list shows information about the first and last posts analyzed for each member, making sure that the time periods for the members on the list are comparable before drawing conclusions.
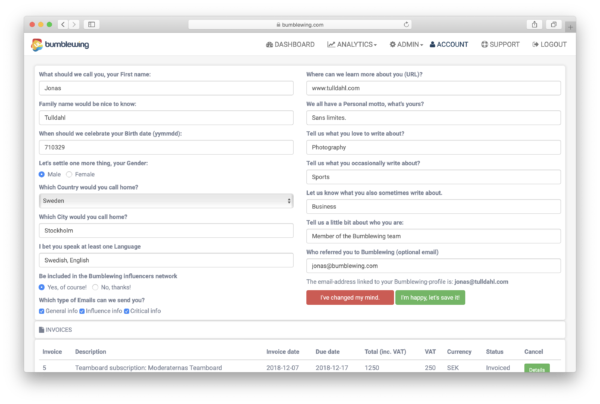
The Account page is your profile page. Here you can update information on your Bumblewing profile, such as language, city, etc.
On this page you also have the opportunity to update email preferences. "General info" is an occasional email that deals with more general information about Bumblewing, such as news. "Influence info" is a weekly-based broadcast with information specific to your flu. "Critical info" is an email that is sent out when Bumblewing has detected a problem with your profile, such as a token that has expired and needs to be renewed.
At the bottom of this page you will also find information about your subscriptions to Bumblewing (if you purchased some) as well as invoices.
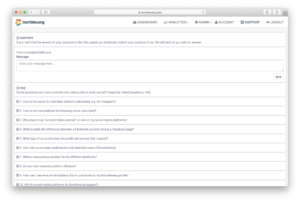
support
If you have questions about Bumblewing, you might wonder how your Bumblewing score is calculated, or why it says "Token expired" where you used to get statistics about your Facebook account, well then the support page is a good page to start with. Here we have gathered the answers to the most common questions we get. If you do not find the answer you are looking for, you can send a question directly to the team at Bumblewing via the support page.
About
We believe in transparency. That is why we have created a fairly comprehensive About page that explains everything about how Bumblewing measures influenza and the considerations we made. We want you to understand how we measure flu and how you can influence your own flu.
feed
Anyone connected as a user to Bumblewing can add #bumblewing to their posts and tweets. If you do, this post will appear in the Bumblewing Feed.
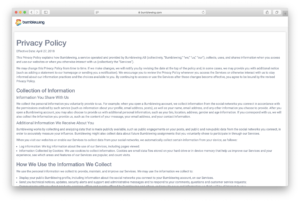
Privacy
We want to be extremely clear on how we use your data. This is what we are trying to describe, in the clearest possible way, on the page called "Privacy".
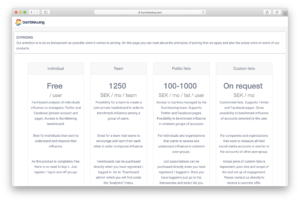
Price
Bumblewing currently has four different products. A service for the individual user who wants to measure and understand their influence, it is free. Teamboard enables individuals, companies and organizations to create private leaderboards with a custom selection of Bumblewing users. To gain full insight into Bumblewing's lists, you need to subscribe to these. And if you want to create your own private lists, you will do well.
You can find everything about these four different products and their prices on this page.
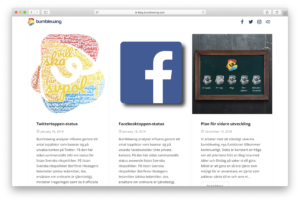
Blog
On the blog we post information that you cannot find anywhere else on Bumblewing, for example this introduction. You can also find information about analyzes that we have done, or other valuable info.